Appendix
In Appendix, I will give you some tips for analyzing Rosetta 2.
Debugging an x86_64 emulation process at the arm64 instruction-level
When analyzing Rosetta 2 with LLDB, we need to trace its behavior at the arm64 instruction-level. However, if you naively start LLDB and run an x86_64 executable, you will find that you can only debug at the x86_64 instruction-level*.
$ cat test.c
#include <stdio.h>

int main() {
    puts("Hello World");
}
$ clang -arch x86_64 test.c -o test.out
$ lldb test.out
(lldb) target create "test.out"
Current executable set to 'test.out' (x86_64).
(lldb) breakpoint set -n main
Breakpoint 1: where = test.out`main, address = 0x0000000100003f60
(lldb) r
Process 63236 launched: '/Users/konakagawa.ffri/Documents/ProjectChampollion/test.out' (x86_64)
Process 63236 stopped
* thread #1, queue = 'com.apple.main-thread', stop reason = breakpoint 1.1
    frame #0: 0x0000000100003f60 test.out`main
test.out`main:
->  0x100003f60 <+0>: pushq  %rbp             ; <--- (x86_64 instructions are displayed)
    0x100003f61 <+1>: movq   %rsp, %rbp
    0x100003f64 <+4>: subq   $0x10, %rsp
    0x100003f68 <+8>: leaq   0x33(%rip), %rdi
Target 0: (test.out) stopped.
* Note that tracing tools such as DTrace does not support x86_64 emulation process tracing. For example, DTrace only displays "DTrace cannot instrument translated processes" and cannot trace the execution flow of an x86_64 emulation process.
How can we debug these x86_64 emulation processes at the arm64 instruction-level?
We can resolve this problem using the following program (runner.c), which only takes command-line arguments and calls execve.
// runner.c
#include <unistd.h>

int main(int argc, char* argv[]) {
    if (argc != 2) {
        return 1;
    }
    execve(argv[1], NULL, NULL);
    return 0;
}
Build runner.c with clang -arch arm64 runner.c -o runner.out.
Then, run the x86_64 executable test.out by specifying it as a command-line argument of runner.out.
$ clang -arch arm64 runner.c -o runner.out
$ lldb runner.out test.out
(lldb) target create "./runner.out"
Current executable set to '/Users/konakagawa.ffri/Documents/ProjectChampollion/runner.out' (arm64).
(lldb) settings set -- target.run-args  "test.out"
After continuing the execution, this program stops at the entry point of the Rosetta 2 runtime.
Then, we can continue debugging this program at the arm64 instruction-level.
(lldb) r
Process 64284 launched: '/Users/konakagawa.ffri/Documents/ProjectChampollion/runner.out' (arm64)
Process 64284 stopped
* thread #2, stop reason = exec
    frame #0: 0x00007ffdfff7a46c runtime`_mh_execute_header + 9324
runtime`_mh_execute_header:
->  0x7ffdfff7a46c <+9324>: mov    x19, sp
    0x7ffdfff7a470 <+9328>: and    sp, x19, #0xfffffffffffffff0
    0x7ffdfff7a474 <+9332>: mov    x29, sp
    0x7ffdfff7a478 <+9336>: ldr    x20, [x19, #0x20]
Target 0: (runtime) stopped.
Why can we debug it at the arm64 instruction-level when we execute it via runner.out?
It seems to be related to the fact that debugserver binaries are different between lldb runner.out test.out and lldb test.out.
If you simply run lldb test.out, the process tree looks like this.
(...snip...)
 | |   |-+= 03574 konakagawa.ffri /Applications/Xcode.app/Contents/Developer/usr/bin/lldb test.out
 | |   | \-+= 03581 konakagawa.ffri /Library/Apple/usr/libexec/oah/debugserver --fd=7 --native-regs --setsid
 | |   |   \--= 03580 konakagawa.ffri /Users/konakagawa.ffri/test.out
(...snip...)
In this case, you can see that the /Library/Apple/usr/libexec/oah/debugserver (called oah debug server in the following) process is running as a child process of lldb test.out.
On the other hand, when you run it through lldb runner.out test.out, the process tree looks like this.
(...snip...)
 | |   |-+= 64282 konakagawa.ffri /Applications/Xcode.app/Contents/Developer/usr/bin/lldb ./runner.out test.out
 | |   | \-+= 64285 konakagawa.ffri /Applications/Xcode.app/Contents/SharedFrameworks/LLDB.framework/Resources/debugserver --fd=7 --native-regs
 | |   |   \--= 64284 konakagawa.ffri (test.out)
(...snip...)
In this case, you can see that /Applications/Xcode.app/Contents/SharedFrameworks/LLDB.framework/Resources/debugserver (hereinafter this is referred to as the native debugger) is running.
In summary, LLDB uses:
/Library/Apple/usr/libexec/oah/debugserveras a debug server in the execution viarunner.out- Otherwise,
/Applications/Xcode.app/Contents/SharedFrameworks/LLDB.framework/Resources/debugserveras a debug server
The oah debug server is supposed to be a debug server created specifically for debugging the x86_64 emulation process. This debug server probably translates LLDB x86_64 instruction-level commands (e.g., stepping and setting breakpoints) to arm64 instruction-level commands. Therefore, executions at the arm64 instruction-level seem to be completely transparent to LLDB.
On the other hand, when you run test.out via runner.out, the native debugger will be launched because runner.out is an arm64 executable.
Internally, the execve is called to execute the x86_64 code, but the native debugger is still used, which enables us to debug at the arm64 instruction-level.
Customizing Ghidra for analyzing AOT files
In part1, I mentioned that I modified Ghidra for analyzing AOT files to:
- Enable Ghidra to disassemble
cfinv, which is not supported in Ghidra 9.2.1 - Improve decompilation results for the proprietary calling convention used in AOT files
In this section, I will introduce how to customize Ghidra for analyzing AOT files.
Adding a new instruction to Ghidra's disassembly engine
Firstly, I will explain how to add the cfinv instruction to Ghidra's disassembly engine.
Introduction to P-Code and SLEIGH
To add a new instruction to Ghidra, we need to edit the SLEIGH file of the target processor.
Before explaining SLEIGH, let me briefly explain P-Code.
P-Code is a language for describing the behavior of processors in a generic way. In Ghidra, each instruction is converted to one or multiple P-Code operations during the disassembly process, so that processor-independent analysis can be performed internally. You can check the converted P-Code by editing the "Edit Listing Field."
Let's look at a simple example. Consider the following arm64 instructions.
1000170dc ldr x8,DAT_100054450
1000170e0 cbz x8,LAB_100017174
1000170e4 mov w20,#0x2
The P-Code operations corresponding to these three instructions are as follows. The corresponding arm64 instructions are shown together as comments.
x8 = LOAD ram(0x100054450:8)          ; ldr x8,DAT_100054450
$U31f0:1 = INT_EQUAL x8, 0:8          ; cbz x8,LAB_100017174
CBRANCH *[ram]0x100017174:8, $U31f0:1 ; cbz x8,LAB_100017174
x20 = COPY 2:8                        ; mov w20,#0x2
The ldr and mov instructions correspond to the LOAD and COPY operations, respectively.
You can also see that the cbz instruction corresponds to two P-Code operations, INT_EQUAL and CBRANCH.
Now, how does Ghidra define the relation between these instructions and P-Code operations? To define this, Ghidra has a domain-specific language, which is called SLEIGH.
Let's look at the description of the SLEIGH file for arm64.
The SLEIGH file for arm64 is located in the folder ${GHIDRA_INSTALL_DIR}/Ghidra/Processors/AARCH64/data/languages/.
$ ls Ghidra/Processors/AARCH64/data/languages
AARCH64.cspec                AARCH64.sla                  AARCH64_base_PACoptions.sinc AARCH64neon.sinc
AARCH64.dwarf                AARCH64.slaspec              AARCH64_win.cspec            AARCH64sve.sinc
AARCH64.ldefs                AARCH64BE.sla                AARCH64base.sinc
AARCH64.opinion              AARCH64BE.slaspec            AARCH64instructions.sinc
AARCH64.pspec                AARCH64ldst.sinc
Open the AARCH64base.sinc file and look at the portion of this file defining the cbz instruction as follows.
The definition consists of several sections:
- Display section: it describes how to display this instruction in the disassembled listings.
- Bit pattern sections: they describe the bit pattern encoding of this instruction.
- Semantics actions section: it describes the semantics of the instruction in C-like syntax (eventually converted to P-Code operations by the SLEIGH compiler)
- In the example below, the conditional expression
Rt_GPR64 == 0is converted toINT_EQUALandif (...) gotois converted toCBRANCH.
- In the example below, the conditional expression
(...snip...)

:cbz Rt_GPR64, Addr19 // <-- The display section describes how to display this instruction and define local identifiers used in the semantics actions section
is sf=1 & b_2530=0x1a & cmpr_op=0 & Addr19 & Rt_GPR64 // <-- The bit pattern sections describe how this instruction is encoded
{
    // The semantics actions section
    // Rt_GPR64 is a general purpose register
    // Addr19 is a jump address when the condition is met
    if (Rt_GPR64 == 0) goto Addr19; // <-- It describes the semantics of this instruction
}

(...snip...)
Please refer to the HTML files under ${GHIDRA_INSTALL_DIR}/docs/languages for more information on the syntax of SLEIGH.
Adding the cfinv instruction to the arm64 Ghidra's SLEIGH file
Let's add the cfinv instruction to the arm64 Ghidra's SLEIGH file.
According to the Arm® Architecture Reference Manual, we can find the description of cfinv as shown in Figure 1.
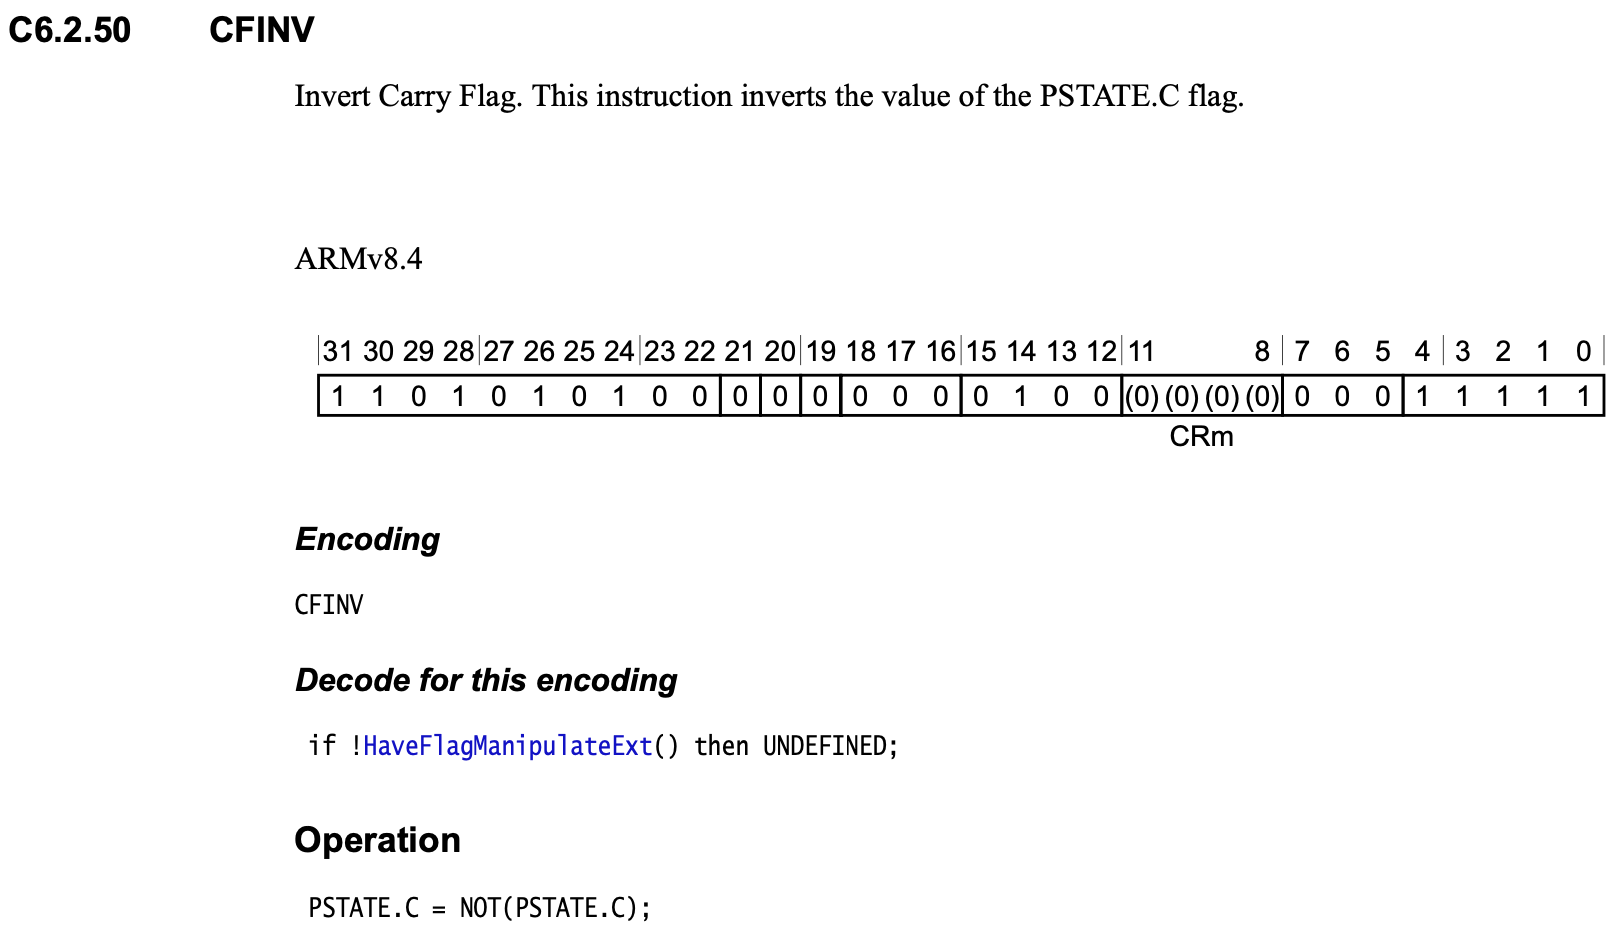
cfinv.You can find that its encoding is 0xd500401f, and it inverts the value of PSTATE.C.
From this, we can define the cfinv instruction as follows.
:cfinv
is b_0031=0xd500401f
{
    CY = !CY;
}
First, in the display section, cfinv does not take any operands.
So, you can simply write cfinv for this section.
In the bit pattern sections, we need to write that b_0031=0xd500401f*, which indicates the bit encoding of this instruction is 0xd500401f.
Finally, in the semantics actions section, we describe the operation of the cfinv instruction.
PSTATE.C is modeled by a variable named CY in SLEIGH, so here we can write the operation inverting PSTATE.C value with the ! operator and reassigning it to CY.
*
b0031is called "token" in SLEIGH, which is used for modeling byte sequences building machine code.
Adding a new calling convention
Next, I will explain how to add a new calling convention used in AOT files to Ghidra.
Compiler specification (CSPEC)
To add a new calling convention to Ghidra, we need to edit the CSPEC file of the target processor.
CSPEC is one of the language modules used in Ghidra for supporting disassembly and analysis of a particular processor. Its purpose is to describe an Application Binary Interface (ABI) of a compiler generating target binaries.
CSPEC is just an XML file that defines:
- Calling conventions
- Data sizes of primitive data types (e.g., the width of
wchar_tandvoid*, which vary depending on platforms and compilers)
For more details, see the documentation of Ghidra decompiler*.
* Since only the source code of the Ghidra decompiler documentation is provided by default, you need to create HTML files following this procedure.
In this section, let me explain the overview of CSPEC by taking a look at the CSPEC file for x86_64 executables built by GCC. Then, I will introduce the CSPEC file for the AOT file analysis.
Example of CSPEC
The CSPEC file for analyzing x86_64 binaries compiled with GCC is located at ${GHIDRA_INSTALL_DIR}/Ghidra/Processors/x86/data/languages/x86-64-gcc.cspec.
I show the part of this file as follows.
<?xml version="1.0" encoding="UTF-8"?>

<compiler_spec>
  <data_organization>
     <absolute_max_alignment value="0" />
     <machine_alignment value="2" />
     <default_alignment value="1" />
     <default_pointer_alignment value="8" />
     <pointer_size value="8" />
     <wchar_size value="4" />
     <short_size value="2" />
     <integer_size value="4" />
     <long_size value="8" />
     <long_long_size value="8" />
     <float_size value="4" />
     <double_size value="8" />
     <long_double_size value="16" />
     <size_alignment_map>
          <entry size="1" alignment="1" />
          <entry size="2" alignment="2" />
          <entry size="4" alignment="4" />
          <entry size="8" alignment="8" />
     </size_alignment_map>
  </data_organization>

...(snip)...

<compiler_spec>
CSPEC always has <compiler_spec> as the root XML tag, and compiler features are described as child elements of this tag.
Here, I will explain two typical elements <data_organization> and <prototype>.
<data_organization> element
This element is used to define the memory alignment and the data sizes of primitive types.
In the above example, the pointer size is 8 bytes because the CSPEC is for x86_64 binaries. You can find the following element specifying the pointer size as follows.
  <data_organization>
...(snip)...
     <pointer_size value="8" />
...(snip)...
  </data_organization>
For the data sizes of primitive types, you can find the following descriptions defining these sizes.
  <data_organization>
...(snip)...
     <wchar_size value="4" />
     <short_size value="2" />
     <integer_size value="4" />
     <long_size value="8" />
     <long_long_size value="8" />
     <float_size value="4" />
     <double_size value="8" />
...(snip)...
  </data_organization>
<prototype> element
This element is used to define calling conventions.
Let's take a look at the description of __stdcall defined in x86-64-gcc.cspec.
...(snip)...
    <prototype name="__stdcall" extrapop="8" stackshift="8">
      <!-- Derived from "System V Application Binary Interface AMD64 Architecture Processor Supplement" April 2016 -->
      <input>
        <pentry minsize="4" maxsize="8" metatype="float">
          <register name="XMM0_Qa"/>
        </pentry>
        <pentry minsize="4" maxsize="8" metatype="float">
          <register name="XMM1_Qa"/>
        </pentry>
...(snip)...
        <pentry minsize="1" maxsize="8">
          <register name="RDI"/>
        </pentry>
        <pentry minsize="1" maxsize="8">
          <register name="RSI"/>
        </pentry>
        <pentry minsize="1" maxsize="8">
          <register name="RDX"/>
        </pentry>
        <pentry minsize="1" maxsize="8">
          <register name="RCX"/>
        </pentry>
        <pentry minsize="1" maxsize="8">
          <register name="R8"/>
        </pentry>
        <pentry minsize="1" maxsize="8">
          <register name="R9"/>
        </pentry>
        <pentry minsize="1" maxsize="500" align="8">
          <addr offset="8" space="stack"/>
        </pentry>
      </input>
      <output>
        <pentry minsize="4" maxsize="8" metatype="float">
          <register name="XMM0_Qa"/>
        </pentry>
        <pentry minsize="1" maxsize="8">
          <register name="RAX"/>
        </pentry>
        <pentry minsize="9" maxsize="16">
          <addr space="join" piece1="RDX" piece2="RAX"/>
        </pentry>
      </output>
      <killedbycall>
        <register name="RAX"/>
        <register name="RDX"/>
        <register name="XMM0"/>
      </killedbycall>
      <unaffected>
        <register name="RBX"/>
        <register name="RSP"/>
        <register name="RBP"/>
        <register name="R12"/>
        <register name="R13"/>
        <register name="R14"/>
        <register name="R15"/>
      </unaffected>
    </prototype>
...(snip)...
You can see that the following child elements of the prototype are defined:
input: it specifies how to pass parameters to a function (e.g., through registers or stack).output: it specifies a storage area for a return value of a function.killedbycall: it describes registers that are destroyed by a function call.unaffected: it describes registers that are preserved across a function call.
For example, the registers specified for unaffected in the above example are RBX, RSP, RBP, R12, R13, R14, and R15.
According to table 3.4 in System V Application Binary Interface AMD64 Architecture Processor Supplement, these registers are specified as "Yes" in the "Preserved across function calls" column.
You can figure out that the description in CSPEC consistent with the System V ABI calling conventions.
The same is true for the elements, such as killedbycall, input, and output.
AARCH64_aot.cspec: CSPEC for analyzing AOT files
As mentioned in part1, a proprietary calling convention is used for function calls in AOT files.
This calling convention is based on the System V ABI calling convention with the x86_64 registers converted to arm64 registers according to the table in part1.
So, we can make a CSPEC file for analyzing AOT files by changing the registers of x86-64-gcc.cspec based on the table.
You can find the CSPEC file I created at the GitHub repository.